Sunday, March 1, 2015

Multichannel Professional Data Logger on Raspberry Pi - Part 3

See the Part 1 for the overall description and Part 2 for the hardware implementation.

Software


The software for Data Logger based on a super handy WebIOPi Internet of Things framework. I would suggest to check their website for more details. We will use version 0.7 of the framework.
The WebIOPi basically consists from a python-based web server, a set of native libraries to communicate with Raspberry Pi and REST interface. Additionally, the WebIOPi supports a variety of analog and digital converters, port expanders and sensors. Installed "from the box", it would allow you to communicate with Raspberry Pi from web, update and retrieve data from your devices, and code a basic UI using the javascript extensions and python macros. Also it has a friendly Apache 2.0 license. Our Data Logger custom UI will rely on WebIOPi REST interface to periodically retrieve data from our 16 ports over two ADC devices. We will have a set of python macros to supply the proper REST endpoints.

I will omit all WebIOPi installation details (see their website). From the WebIOPi config standpoint, we need to configure two GPIO ports to automatic pull-up in OUT mode. This two ports will be used in low-power detection logic. The state of this two ports will be periodically analyzed, and if port 18 is "0" - the Data Logger will start playing an annoying alert beeps (means the battery is low), and right after the port 23 will get to "0" (means the battery is almost dead) - the Data Logger will loudly announce the "initiate of shutdown sequence" and power off.
Also we need to configure and enable two ADC devices. The reference voltage is 2.5 V.

[GPIO]
# Initialize following GPIOs with given function and optional value
# This is used during WebIOPi start process
18 = OUT 2
23 = OUT 2

...
... 
[DEVICES]
adc0 = MCP3008 chip:0 vref:2.5
adc1 = MCP3008 chip:1 vref:2.5


We will supply our own custom python script which runs by WebIOPi framework and register it in the WebIOPi config in "[SCRIPTS]" section. The script implements several mandatory methods: setup(), destroy() and loop() which are called by WebIOPi at script loading, at server shutdown, or periodically. Also we have to add in this script a several REST endpoints as a python macros (annotated as @webiopi.macro) in code:
  • getAvailableSpace() - return a free space in MB on Raspberry Pi;
  • toC() - serialize a user configuration settings on file system;
  • getDate() - return a local date and time on Raspberry Pi;
  • getTempSimple() - return a current set of values from Temperature ADC in JSON format;
  • getVISimple() - return a current set of values from Voltage/Current ADC in JSON format;
  • startRead() - enable reading and serialization of values from both ADCs;
  • stopRead() - disable reading and serialization;
The REST endpoints were called by jQuery handlers on UI side. Below is a screenshot of Configuration screen. Notice the familiar Bootstrap look-and-feel.


The UI includes two base screens - Configuration and Status (below). On the Configuration screen you can select the types and enter the names of your input ports (two sections: Temperature Channels and V & I Channels), specify "Recording Mode". It means mostly how long you would like the Data Logger to run - until data storage fills up or until trigger signal received on GPIO port (currently disabled). The data store overfill is very hard to achieve, we had Data Logger with common 4GB SD card running successfully for several days with the most aggressive settings. Another option is "Sampling Interval" - the number of seconds between data collection events (1...60). The last section is "Start Mode" - you can start the Data Logger immediately after saving the settings, by specifying a date and time, or manually by selecting a menu option on Status screen.


The Status screen is what you will be looking on the most of your time. It displays a mesmerizing live feed of data from sensors with the intervals previously defined on Configuration screen. The graph is based on d3 framework , with the Rickshaw JavaScript toolkit on top - to make a graph coding simpler (for example note the roller on the graph horizontal axis, this is just three lines of code). The table grid is also represent a live data, channels can be filtered out by Search field - thanks to the DataTables JQuery plugin.

The menu system on Status screen is very simple. The Export option allows you to download the CSV file with the collected data. Note that when a configuration gets updated on Configuration screen, the CSV files are rewritten, so you always get a latest data. If you need to keep the recording results for future - make sure that you export the data before updating configuration.
If on Configuration screen for Starting Mode you selected "Start Menu on Status Screen" (like on the screenshots), you will get one additional menu option named "Action". There you can pick "Start" or "Stop" option to control the logging process manually.

The last moment worth to mention is that the Data Logger also works as a Wireless Router and Access Point, since the easiest way to get the data from it is to use Web UI over Wi-Fi. For the detailed instructions I'll redirect to the nice article which I followed with a small variations. The Raspberry Pi is a regular Linux box, so basically it should have a DHCP server, Wireless Access Point, Routing and IP-Forwarding services configured. With a proper (Realtek-based) Wi-Fi dongle it work flawlessly in the field, and can provide internet to your tablet, laptop or phone in lab if you plug Ethernet cable from your cable or modem in the Raspberry Pi jack.

Multichannel Professional Data Logger on Raspberry Pi - Part 2

See the Part 1 for the overall description and Part 3 for the software implementation.

Hardware


The most interesting part to deal was the hardware. Below you can see an old prototype board, which includes a Raspberry Pi, two custom boards for ADC, sensor connectors and voltage dividers. In the middle - a small board to supply a power. It has real-time input voltage monitoring: on 7.5V - the Data Logger start making warning sounds, on 7.0 V - automatic shutdown. Two power supplies: AC-DC external, and internal pack batteries. Also the embedded ORing controller makes a smooth transition between battery and external power supply.


The boards has been designed and implemented by Boris Shogan, my old friend and awesome Electronics Engineer. It took a noticeable amount of collaborative work in our spare time and midnight oil burnt to make this happen. But it was a plenty of fun.

Since we need 16 ports total, the natural choice was to take two MCP3008 8-Channel 10-Bit ADC with SPI interface, and have it on two standalone boards (a compact 16-port single board which hosts both ADC is also available).

Originally we had it working on Raspberry Pi Model B (512 MB RAM), and later used the Model B+. We did not tried the Raspberry Pi 2, it was released just a few days ago.

Below is the IV-board for Currency and Voltage. The low-side external Shunt or Sense resistors are plugged to the blue connectors:


Currently this types of Shunt and Sense resistors are supported by default, other types can be easily added:
  • Shunt 500A 50mV
  • Shunt 300A 50mV
  • Shunt 100A 100mV
  • Shunt 100A 50mV
  • Shunt 10A 100mV
  • Shunt 2A 100mV
  • Sense R=0.1 15A
  • Sense R=0.1 20A
  • Sense R=0.25 14A
Below is T-board for Temperature measurements. The sensor is J-type thermocouples (also not shown, can be plugged to the connectors on the bottom).


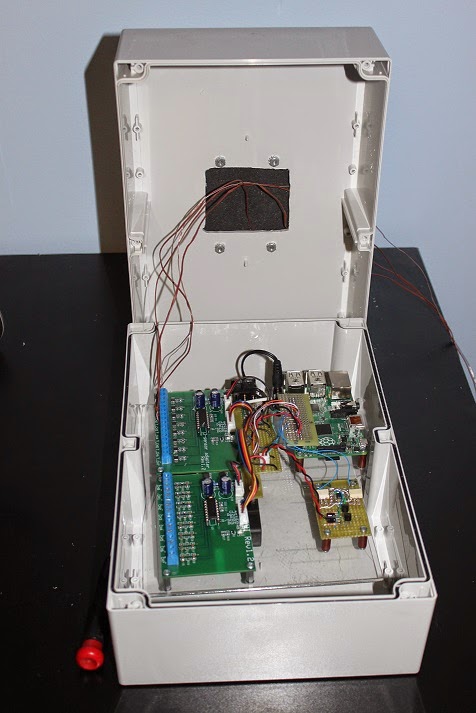
See below the image of the complete product in the box. We have been given the enclosure, and this Customer asked us to make a table-top version, so here it is. Meantime we are working on a smaller "portable" version. Stay tuned.

Feel free to get back to me if you would like to get more details about the system, get a copy of software, or customized version for your needs. You can also purchase the assembled ADC boards or DIY kits.

Multichannel Professional Data Logger on Raspberry Pi - Part 1

See the Part 2 for the hardware and Part 3 for the software implementation.

In this series of articles I'll explain how to build a multichannel Data Logger, capable of collecting voltage, current and temperature measurements over the specified intervals of time.

Our alternate goal is to proof that Raspberry Pi is not just a nice tool to promote teaching of basic computer skills in school, but a serious instrument capable of handling professional tasks.

A "data logger" definition from Wikipedia: "A data logger is an electronic device that records data over time, or in relation to location either with a built in instrument or sensor or via external instruments and sensors".

Requirements


Let's first clarify our requirements. As a field / service engineer, I want to have:
  • 8 input ports which can measure temperature in ranges between 0 and 260 C (about 32...500 F);
  • 8 input ports to measure either voltage (30mV ... 30V, +/- 2mV) or current (10mA ... 500A);
  • time measurement interval (1 ... 60 sec);
  • a simple way to configure data logger and store configuration parameters between restarts;
  • an intuitive way to retrieve collected data or represent it in graph format;
Nice-to-haves:
  • lightweight and portable solution: logger should run on batteries; 
  • easy to handle and operate in both field or in lab conditions;
  • Desktop or laptop computer is not needed to operate and collect data;
The requirements above would let you have a tool to test or tune your Segway, car or boat electric circuits, chicken incubator, solar battery or greenhouse.

Architecture and Design


The Raspberry Pi itself is a single-board computer, we will run a Raspbian Linux distribution on it.We need to build an additional custom board, which will have an Analog-to-digit converter (ADC), connectors for shunts and sensing resistors, temperature sensors, power stabilizer and power outage notifier (we are running on accumulators when we are in the fields).

From the connectivity standpoint - our Data Logger will be accessible over WiFi. We will put a WiFi dongle in one of the Raspberry Pi USB ports. The WiFi will be configured in HOST mode, so basically in field conditions you can see the Data Logger on your phone or tablet as a "Wireless Network". You can connect to it and access the Data Logger by IP. In case if you work with Data Logger in lab, you can plug your Ethernet cable into the Raspberry Pi and the Data Logger can serve as a free wireless router or WiFi extender.
See hardware and network diagram below.


Software will be based on assumption that we build a network-connected Data Logger. We will have a web user interface, so all logging configuration can be made from your favorite web browser. The collected data will output on screen in real time and represented as a set of graphs. Alternatively user will have ability to download a whole collected set of data as CSV file and analyze it (for example in MS Excel).


Above is a software design diagram. The ADC connected to Raspberry Pi GPIO ports, we need a way to program ADC and read its values. Also we need a service which will retrieve the ADC data from specified ports over a specified time periods, store and retrieve the configuration settings. We will use REST service to provide a user an easy access to the data and configuration. The Web User Interface consists from two screens: Configuration (so set interval, select ports, trigger conditions) and Status (display retrieved data and draw graphs, export data).